No jargon, no black boxes. Here's what each number on your Setpilot dashboard means, and how we work it out, in plain language.
The money coming in, what your customers paid you, before any of your costs. Setpilot starts from the full order value and peels back discounts, returns and tax to reach your true revenue.
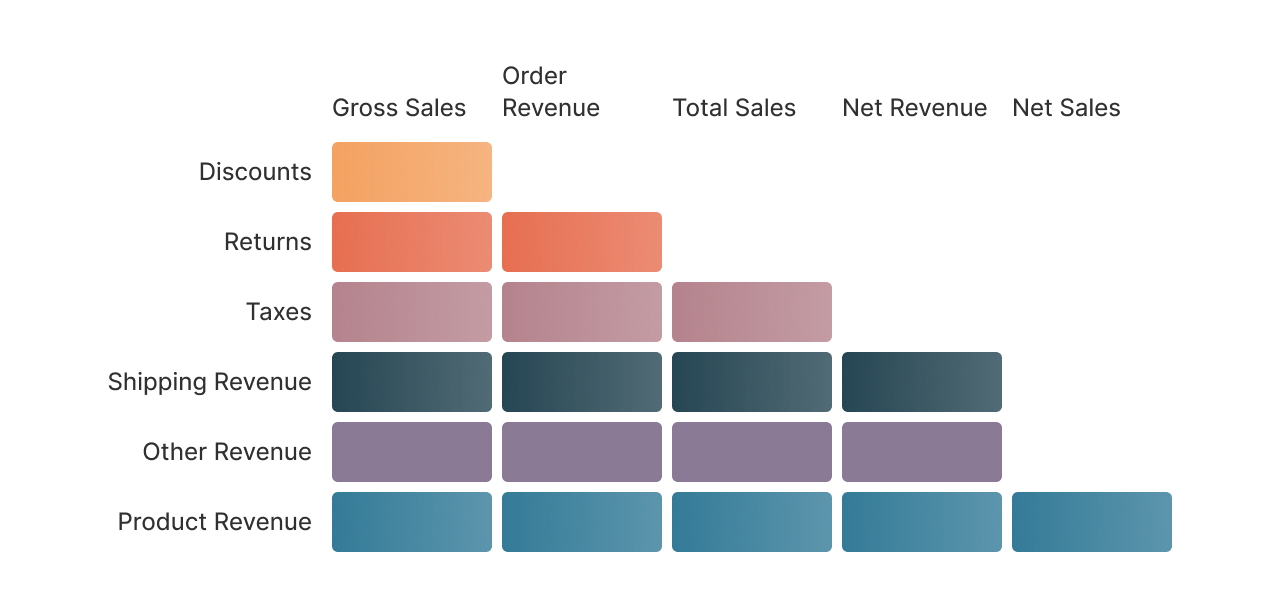
| Metric | What it means |
|---|---|
| Gross sales | The full value of what customers were charged, before any discounts or refunds. |
| Order revenue | Gross sales after discounts are applied. |
| Total sales | Order revenue after returns and refunds are taken out. |
| Net revenue | Total sales with tax removed; your true top line. |
| Net sales | Net revenue from products alone, with shipping and other charges set aside. |
Each level is built from the same parts of every order: product revenue, shipping revenue, other charges, tax, returns and discounts.
Everything it takes to fulfil an order. Setpilot always fills in a value, even when some details are missing, so your profit is never overstated.
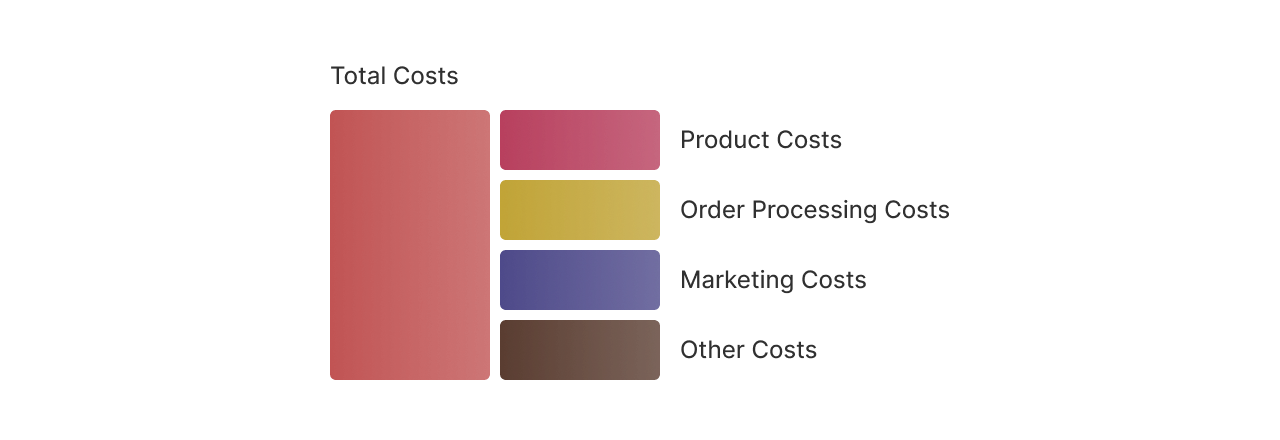
| Cost | What it means |
|---|---|
| Product costs | What you paid your supplier for the items in the order. If you haven't set a cost for a product, we use your default margin so the figure stays realistic. |
| Order processing costs | The cost of getting the order out the door: shipping, payment-provider fees, and any handling or packaging you've set up. Shipping on an already-shipped order stays even if it's later refunded, the carrier was already paid. |
| Marketing costs | Your ad spend, spread across the orders that came in that day. Only online-store orders carry ad cost, in-person and draft orders don't. |
| Other costs | Any remaining business costs you've added that don't fit the categories above. |
Add the four together and you get your total costs, the figure Setpilot subtracts from revenue to work out profit.
Setpilot peels back your costs one layer at a time, so you can see exactly where your margin goes. Each step takes the one above and removes the next group of costs.
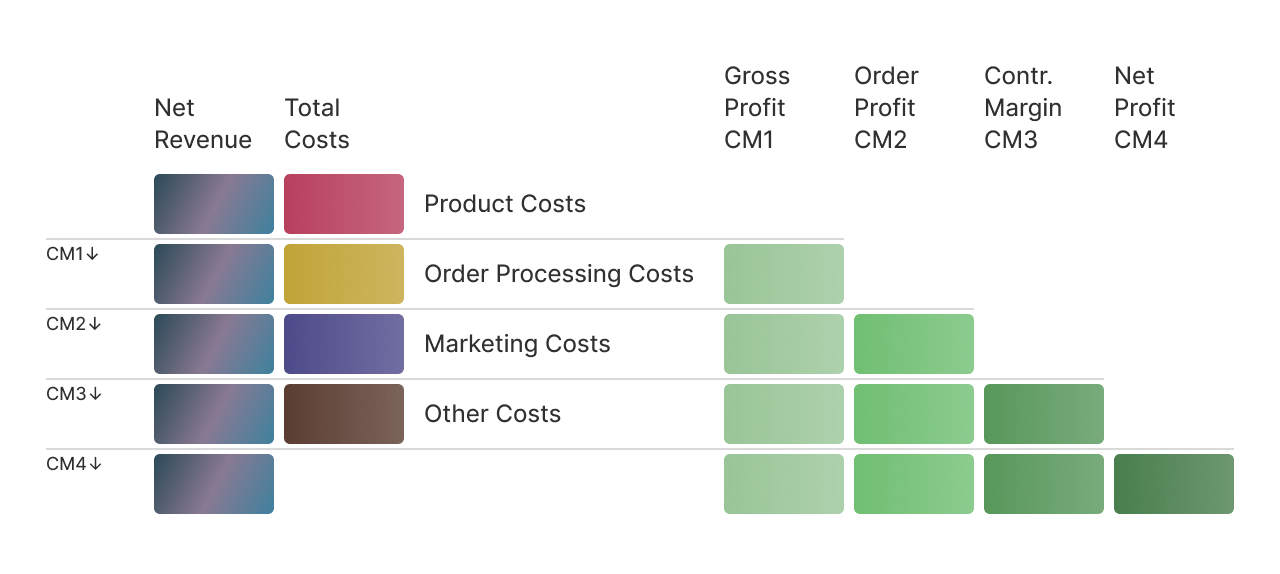
Alongside the amounts, we also show each step as a percentage of your revenue, so you can compare months at a glance.
How hard your ad spend is working.
| Metric | What it means |
|---|---|
| Ad spend | What you spent on each channel, Facebook/Meta, Google, and others. |
| Total spend | All your ad spend added up. |
| ROAS | Return on ad spend, the revenue you earned for every €1 spent on ads. |
| CAC | Customer acquisition cost, how much ad spend it takes to win one new customer. |
| AOV | Average order value, the typical amount a customer spends per order. |
New shoppers versus people coming back. Every order is tagged as a customer's first purchase or a repeat, and that drives these numbers.
| Metric | What it means |
|---|---|
| New orders | Orders from first-time customers. |
| Returning orders | Orders from customers who had bought from you before. |
| Total orders | All the orders in the period. |
| New vs. returning % | The share of your orders coming from new versus returning customers. |
| Lifetime value | The total a customer has spent with you over time. |
Whether you're about to run out, or sitting on too much. We look at how fast each product has been selling lately to estimate how long your stock will last.
| Metric | What it means |
|---|---|
| In stock | Units you have on hand right now. |
| Sold (last 90 days) | How many units you've sold recently. |
| Daily sales rate | How fast it's selling: units sold in the last 90 days divided by 90. |
| Days of stock left | How long your stock will last: units in stock divided by the daily sales rate. |
| Stock status | Out of stock, low (under about a month left), overstock (more than ~6 months or not selling), or healthy. |
| Stock health % | The share of your products sitting in a healthy stock range. |
| Inventory value | What your current stock is worth, units on hand times their cost. |
The labels Setpilot puts on each order, so you can filter and group your reports any way you like.
| Detail | What it means |
|---|---|
| Payment status | Whether the order is paid, pending, refunded or partially refunded. |
| Fulfilment status | Whether the order is fulfilled, unfulfilled or partly fulfilled. |
| Source & payment method | Where the order came from and how the customer paid. |
| Order revenue | The order's net revenue. |
| Order profit | The order's profit after its fulfilment costs. |
 Install free trial